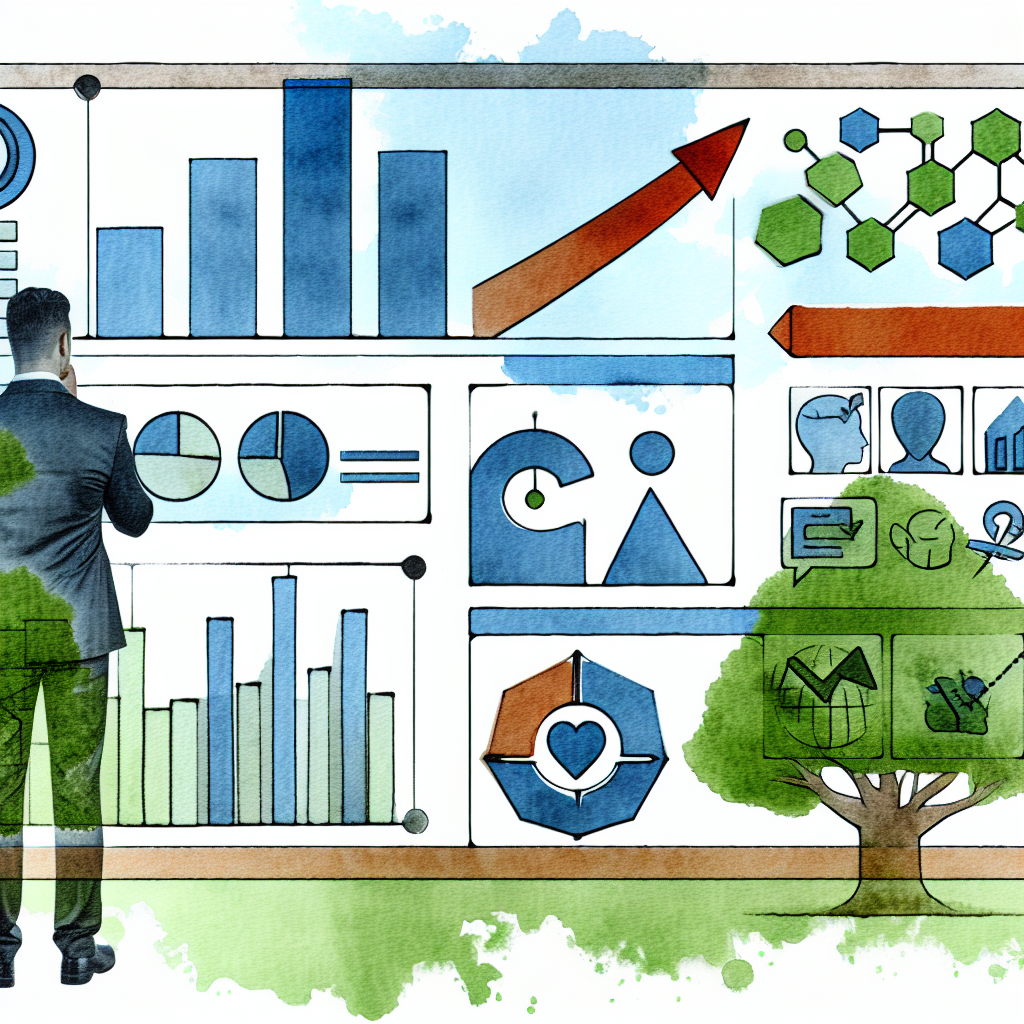
Introduction to Financial Dashboards
In today’s fast-paced business environment, making informed decisions quickly is paramount. Financial dashboards have emerged as a powerful tool for businesses looking to gain critical insights into their financial health and operations. These dashboards consolidate various financial data points into a singular, easy-to-digest visual format. The accessibility and clarity provided by financial dashboards can significantly enhance a business’s ability to make timely, well-informed decisions.
Financial dashboards are not just about pretty charts and graphs. They offer a deeper understanding of financial analytics, providing a comprehensive view of a company’s finances. This can include anything from revenue trends and profit margins to cash flow and expenditure patterns. By presenting financial data in a visual format, these dashboards allow stakeholders to quickly grasp complex financial information, making it easier to identify trends, anomalies, and potential areas for improvement.
Moreover, the use of financial dashboards is not limited to large corporations. Small and medium-sized enterprises (SMEs) can also benefit significantly. For SMEs, financial dashboards provide a means to monitor financial health without requiring a full-time financial analyst. This democratization of financial insights ensures that businesses of all sizes can make data-driven decisions to drive growth and profitability.
In essence, financial dashboards serve as a bridge between raw financial data and actionable business insights. By converting numbers and spreadsheets into visual data stories, they offer an intuitive way for businesses to understand their past performance, current position, and future potential. The deployment of financial dashboards, therefore, is not merely a technological upgrade; it’s a strategic advantage that modern businesses can’t afford to ignore.
Importance of Real-Time Data Visualization
One of the most significant advantages of financial dashboards is the ability to visualize real-time data. In an era where business landscapes can change overnight, having access to the most current data is essential for making timely decisions. Real-time data visualization means that as soon as new financial data is generated, it is automatically updated in the dashboard, giving businesses a constant pulse on their financial status.
This immediacy allows for agile decision-making. For instance, if a sudden drop in sales is detected, immediate actions can be taken to mitigate potential losses. The ability to monitor cash flows, expenses, and revenues in real-time ensures that businesses can respond promptly to emerging trends or issues. Delayed data can lead to missed opportunities or, worse, exacerbate financial problems before they are identified.
Furthermore, real-time data visualization in financial dashboards provides a competitive advantage. By having up-to-the-minute insights, a business can stay ahead of its competitors who may still be relying on outdated data. This proactive stance enables better strategic planning and more efficient resource allocation. Additionally, it fosters a culture of data-driven decision-making within the organization.
Here is a table illustrating the key benefits of real-time data visualization in financial dashboards:
| Benefit | Description |
|---|---|
| Timely Decision-Making | Enables immediate action based on current data |
| Competitive Advantage | Helps stay ahead of competitors through up-to-date insights |
| Risk Mitigation | Identifies issues early to prevent potential financial setbacks |
| Enhanced Strategic Planning | Allows for more accurate forecasting and resource allocation |
In summary, the real-time data visualization feature of financial dashboards is indispensable for modern businesses. It provides a foundation for rapid, informed decision-making, allowing companies to navigate the complexities of today’s economic environment effectively.
Enhanced Decision-Making Through Financial Dashboards
Financial dashboards play a critical role in enhancing decision-making processes within an organization. By providing a centralized platform that consolidates various financial metrics, these dashboards eliminate the need for manual data gathering and analysis, thereby reducing human error and increasing efficiency.
One of the major advantages of using financial dashboards is their ability to provide clear and concise financial overviews. Business leaders can quickly grasp the financial status and make informed decisions without getting bogged down by complex spreadsheets or disparate data sources. This streamlined approach fosters quicker decision-making, which is crucial in today’s fast-paced business environment.
Additionally, financial dashboards can offer predictive insights through advanced analytics. Many modern dashboards come equipped with features like predictive modeling and trend analysis, which can forecast future financial conditions based on historical data. This empowers businesses to proactively address potential challenges and capitalize on emerging opportunities.
Here is a breakdown of how financial dashboards enhance decision-making:
- Centralized Data: Consolidates various financial metrics into one platform, making it easier to analyze.
- Clear Overviews: Provides a straightforward snapshot of financial health, aiding quick decisions.
- Predictive Insights: Uses advanced analytics to offer forecasts, helping in proactive planning.
In conclusion, the value of financial dashboards in enhancing decision-making cannot be overstated. By offering centralized, clear, and predictive financial insights, these tools enable business leaders to make more informed and timely decisions.
Key Metrics and KPIs Tracked in Financial Dashboards
Financial dashboards are equipped to track a variety of Key Performance Indicators (KPIs) and metrics crucial for understanding a company’s financial health. While the specific KPIs may vary depending on the industry and business goals, some key metrics are universally important.
One of the most commonly tracked KPIs is the Revenue metric. This provides an overview of the total income generated from sales and other operations. Monitoring revenue trends helps businesses assess their market performance and make strategic adjustments. Another crucial metric is the Net Profit Margin, which measures the profitability of a company after all expenses have been deducted. This KPI is essential for understanding a company’s efficiency in generating profit compared to its revenue.
Other important KPIs include the Current Ratio, which provides insight into a company’s ability to pay off its short-term liabilities with its short-term assets. This is crucial for assessing liquidity and overall financial stability. Similarly, tracking the Debt-to-Equity Ratio offers a perspective on the company’s financial leverage, indicating how much of the company is financed by debt compared to shareholder equity.
Here is a table showcasing some essential KPIs tracked in financial dashboards:
| KPI | Description |
|---|---|
| Revenue | Total income generated from sales and other operations |
| Net Profit Margin | Profitability after all expenses have been deducted |
| Current Ratio | Ability to pay off short-term liabilities with short-term assets |
| Debt-to-Equity Ratio | Financial leverage of the company |
| Cash Flow | Inflows and outflows of cash |
By keeping a close watch on these KPIs, businesses can gain a holistic view of their financial performance. This allows for more effective strategy formulation and operational adjustments, ultimately contributing to sustainable growth and profitability.
Customization and Flexibility of Financial Dashboards
One of the standout features of financial dashboards is their customization and flexibility. Unlike static reports or generic financial statements, dashboards can be tailored to meet the specific needs of a business. This adaptability ensures that the dashboard delivers the most relevant and actionable insights to its users.
Customization options in financial dashboards allow businesses to choose which metrics and KPIs to monitor, ensuring that the dashboard aligns with their strategic priorities. For instance, a retail business might focus on sales revenue, customer acquisition cost, and inventory turnover, while a service-oriented company might prioritize metrics like billable hours, client retention rate, and project margins. This level of customization ensures that the dashboard provides maximum value by highlighting the most critical financial data.
Moreover, financial dashboards offer flexibility in how data is presented. Users can choose from various visualization options, such as bar charts, line graphs, pie charts, and heat maps, to name a few. This flexibility in data representation makes it easier for different stakeholders to interpret the information. For example, CFOs might prefer detailed trend analyses, while CEOs might opt for high-level summaries.
Additionally, the ability to create multiple dashboard views for different departments or user roles adds another layer of flexibility. This allows each team within an organization to focus on the financial data most pertinent to their functions. Whether it’s the marketing team tracking campaign ROI or the HR department monitoring payroll expenses, customized dashboards make it easier for everyone to access the insights they need.
In conclusion, the customization and flexibility of financial dashboards make them an invaluable tool for businesses. By allowing companies to tailor the dashboard to their specific needs and preferences, these tools ensure that the most relevant and actionable insights are always at their fingertips.
Integration with Other Financial Tools and Systems
Financial dashboards are most effective when they can integrate seamlessly with other financial tools and systems. This integration capability ensures that all relevant data is captured and reflected in the dashboard, providing a comprehensive view of the business’s financial health.
One significant advantage of integration is the elimination of data silos. When financial dashboards are integrated with accounting software, ERP systems, CRM platforms, and other financial tools, it ensures that data is not fragmented across different systems. This unified data approach enables more accurate and holistic financial analysis, which is crucial for informed decision-making.
Moreover, integration enhances the functionality of financial dashboards. For example, integrating with a CRM system can provide insights into customer-related financial metrics, such as customer lifetime value (CLV) and customer acquisition cost (CAC). Similarly, integrating with an ERP system can offer a more detailed view of inventory costs, vendor payments, and other operational expenses.
Here is a table summarizing the benefits of integrating financial dashboards with other tools:
| Integration Tool | Benefits |
|---|---|
| Accounting Software | Unified financial reporting, real-time updates |
| CRM Systems | Customer metrics, better sales forecasting |
| ERP Systems | Detailed operational costs, inventory management |
| HR Software | Payroll insights, employee productivity metrics |
In summary, the ability to integrate financial dashboards with other financial tools and systems significantly enhances their utility. This integration ensures that all relevant data is captured, providing a comprehensive and accurate view of the business’s financial status.
Increased Efficiency and Productivity
The deployment of financial dashboards can lead to substantial improvements in efficiency and productivity for businesses. By automating the collection and analysis of financial data, these dashboards free up valuable time and resources that can be redirected towards more strategic activities.
One of the most significant ways financial dashboards improve efficiency is by automating the reporting process. Traditionally, financial reporting can be a labor-intensive task, requiring hours of manual data entry and analysis. Financial dashboards streamline this process by automatically capturing and presenting key financial metrics, reducing the risk of human error and speeding up the reporting cycle.
Moreover, the intuitive design of financial dashboards enables quick access to crucial financial information. Instead of sifting through multiple spreadsheets or documents, users can gain insights from a single, consolidated platform. This ease of access dramatically boosts productivity, allowing team members to focus on analysis and decision-making rather than data gathering.
Additionally, financial dashboards often come equipped with features like alerts and notifications, which further enhance productivity. These features can automatically notify stakeholders of significant changes or anomalies in key financial metrics, prompting timely actions. For instance, an alert for a sudden dip in cash flow can trigger an immediate review and corrective measures.
The table below highlights how financial dashboards contribute to increased efficiency and productivity:
| Aspect | Efficiency/Productivity Gain |
|---|---|
| Automated Reporting | Reduces manual labor, speeds up reporting cycles |
| Consolidated Insights | Quick access to crucial data, enhances analysis |
| Alerts and Notifications | Prompt actions on significant changes, proactive management |
In conclusion, the implementation of financial dashboards can lead to significant improvements in a business’s efficiency and productivity. By automating data collection and reporting, streamlining access to critical insights, and providing timely alerts, these tools enable businesses to operate more effectively and focus on driving growth.
Risk Management and Forecasting Benefits
Financial dashboards play a pivotal role in enhancing a company’s risk management and forecasting capabilities. By providing real-time visibility into financial conditions, these dashboards enable businesses to identify and mitigate risks proactively, ensuring long-term stability and growth.
One of the key benefits of financial dashboards in risk management is the identification of financial anomalies. By continuously monitoring various financial metrics, dashboards can quickly highlight any deviations from expected patterns. For instance, a sudden spike in operational costs or a decline in revenue can be immediately flagged, allowing for a timely investigation and corrective actions. This real-time anomaly detection is crucial for minimizing financial risks.
Moreover, financial dashboards enhance forecasting accuracy through advanced analytical capabilities. Many dashboards incorporate predictive analytics tools that leverage historical data to forecast future financial conditions. This allows businesses to create more accurate budgets, financial plans, and growth strategies. For example, by forecasting cash flow trends, businesses can ensure they have sufficient liquidity to meet future obligations and avoid potential financial crises.
Financial dashboards also support scenario analysis, a crucial component of risk management. By simulating different financial scenarios based on varying assumptions, dashboards help businesses understand the potential impact of different risks and opportunities. This enables more informed decision-making and strategic planning.
Here’s a table summarizing the benefits of financial dashboards in risk management and forecasting:
| Aspect | Benefit |
|---|---|
| Anomaly Detection | Quick identification of financial deviations, prompt corrective actions |
| Predictive Analytics | More accurate forecasting of future financial conditions |
| Scenario Analysis | Understanding the impact of different risks and opportunities |
In summary, financial dashboards significantly enhance a company’s risk management and forecasting capabilities. By providing real-time anomaly detection, enabling accurate forecasting, and supporting scenario analysis, these tools help businesses navigate uncertainties and plan more effectively for the future.
Improved Financial Reporting Accuracy
Accurate financial reporting is critical for any business, as it informs stakeholders about the company’s financial health and performance. Financial dashboards greatly enhance the accuracy of financial reporting by automating data collection and analysis, thereby reducing the risk of human error.
One of the key ways financial dashboards improve reporting accuracy is through data integration. By pulling data from various systems and consolidating it into a unified dashboard, these tools ensure that all relevant financial information is captured and accurately reflected. This eliminates the discrepancies that often arise from manual data entry and fragmented data sources.
Moreover, financial dashboards provide real-time updates, ensuring that the financial reports reflect the most current data. This is particularly important for businesses that operate in dynamic environments where financial conditions can change rapidly. Real-time reporting ensures that stakeholders have an accurate and up-to-date picture of the company’s financial status, enabling more informed decision-making.
Additionally, financial dashboards offer customizable reporting options, allowing businesses to tailor their reports to meet specific needs and compliance requirements. For instance, businesses can create detailed reports for internal analysis or high-level summaries for board meetings. This flexibility ensures that the reports are relevant, accurate, and aligned with the organization’s goals.
The table below highlights how financial dashboards contribute to improved financial reporting accuracy:
| Aspect | Reporting Accuracy Improvement |
|---|---|
| Data Integration | Eliminates discrepancies from manual data entry and fragmented sources |
| Real-Time Updates | Ensures reports reflect the most current and accurate data |
| Customizable Reports | Tailors reports to specific needs, enhancing relevance and accuracy |
In conclusion, the accuracy of financial reporting is significantly enhanced by the use of financial dashboards. By integrating data from various sources, providing real-time updates, and offering customizable reporting options, these tools ensure that businesses can produce precise and reliable financial reports.
Case Studies of Businesses Successfully Using Financial Dashboards
The deployment of financial dashboards has been transformative for many businesses across various industries. Here, we explore a few case studies that highlight the tangible benefits and successes achieved through the use of financial dashboards.
Case Study 1: Retail Chain
A leading retail chain faced challenges in managing its extensive range of products and multiple store locations. They implemented a financial dashboard to streamline their financial management processes. By integrating data from their point of sale (POS) systems, ERP, and CRM, the dashboard provided real-time insights into sales, inventory levels, and operational costs. This comprehensive view enabled the retail chain to optimize inventory management, reduce wastage, and boost profitability. Additionally, the dashboard’s predictive analytics helped in more accurate sales forecasting, further enhancing their strategic planning.
Case Study 2: Manufacturing Company
A manufacturing company with a complex supply chain and production process implemented a financial dashboard to better manage its financial operations. By integrating data from their ERP and accounting software, the dashboard provided a clear view of production costs, vendor payments, and cash flow. The real-time data visualization feature allowed the company to quickly identify and address cost overruns and inefficiencies. As a result, the company improved its cost management, increased operational efficiency, and enhanced its overall financial health.
Case Study 3: Healthcare Provider
A healthcare provider with multiple facilities implemented a financial dashboard to gain better insights into its financial performance. By integrating data from their patient management system, billing software, and payroll system, the dashboard offered a comprehensive view of revenue streams, operational costs, and staff productivity. This holistic view enabled the healthcare provider to optimize resource allocation, improve revenue cycle management, and enhance patient care services. The real-time data visualization also helped in identifying trends and making proactive adjustments.
The table below summarizes the key benefits achieved by these businesses through the use of financial dashboards:
| Business | Key Benefits |
|---|---|
| Retail Chain | Optimized inventory management, reduced wastage, improved profitability |
| Manufacturing Company | Enhanced cost management, increased operational efficiency |
| Healthcare Provider | Better resource allocation, improved revenue cycle management, enhanced patient care |
These case studies clearly demonstrate the transformative impact of financial dashboards on businesses across different industries. By providing real-time insights, enabling better financial management, and supporting strategic planning, financial dashboards have become indispensable tools for modern enterprises.
Conclusion: The Future of Financial Dashboards in Business
As we look to the future, the role of financial dashboards in business is set to become even more critical. With advancements in technology, financial dashboards are evolving to offer more sophisticated features and capabilities, making them indispensable tools for financial management and decision-making.
The integration of artificial intelligence (AI) and machine learning (ML) is poised to take financial dashboards to the next level. These advanced technologies can provide deeper insights and more accurate forecasts by analyzing vast amounts of data and identifying complex patterns. This will enable businesses to make even more informed and strategic decisions, enhancing their competitive edge in the marketplace.
Moreover, as businesses continue to embrace digital transformation, the demand for real-time data and agile decision-making will only increase. Financial dashboards, with their ability to provide real-time insights and visualizations, will play a pivotal role in meeting this demand. They will continue to be a cornerstone of financial management, helping businesses navigate the complexities of the modern economic landscape.
In summary, the future of financial dashboards in business is bright. By leveraging advanced technologies and providing real-time, actionable insights, these tools will continue to empower businesses to achieve greater efficiency, productivity, and profitability.
Recap
Here are the main points covered in this article:
- Introduction to Financial Dashboards: Explained the significance of financial dashboards in providing business insights.
- Importance of Real-Time Data Visualization: Highlighted the benefits of real-time data visualization in agile decision-making.
- Enhanced Decision-Making: Discussed how financial dashboards streamline decision-making processes.
- Key Metrics and KPIs Tracked: Covered essential KPIs and metrics tracked in financial dashboards.
- Customization and Flexibility: Explained the importance of customization and flexibility in financial dashboards.
- Integration with Other Tools: Discussed the benefits of integrating financial dashboards with other financial tools.
- Increased Efficiency and Productivity: Explained how financial dashboards enhance efficiency and productivity.
- Risk Management and Forecasting: Highlighted the role of financial dashboards in risk management and forecasting.
- Improved Financial Reporting Accuracy: Discussed how financial dashboards improve the accuracy of financial reporting.
- Case Studies: Presented case studies of businesses successfully using financial dashboards.
- Conclusion: Provided insights into the future of financial dashboards in business.
FAQ
1. What are financial dashboards?
Financial dashboards are visual tools that consolidate various financial data points into a singular, easy-to-digest format, providing insights into a company’s
Deixe um comentário